Differential Power Analysis example
Based on what’s introducted in the previous pages, this tutorial will now show now to setup a classical Differential Power Attack (DPA) using Lascar.
For that, a DpaEngine is
instanciated and registered it to a Session.
The folder lascar/examples/base contains examples for different kinds of side-channel attacks/characterization.
The traces used in this example will be simulated using the
BasicAesSimulationContainer:
from lascar import BasicAesSimulationContainer

container = BasicAesSimulationContainer(500, noise=1)
Then, there are three requirements for instanciating the
DpaEngine:
- a name for the engine (“dpa” in our case),
- a selection function (under guess hypothesis): this function will separate the traces into two sets, depending on a hypothesis: “guess”. This function will be applied on every trace values, for every possible guess.
- a guess range: what are the guesses you want to test?
In this example, we will focus on the LSB bit of the 3rd AES sbox. This value is conditioned by a single key byte (256 guesses).
from lascar.tools.aes import sbox
from lascar import DpaEngine

def selection_function(value, guess):
    return sbox[value["plaintext"][3] ^ guess] & 1

guess_range = range(256)
dpa_engine = DpaEngine("dpa", selection_function, guess_range)
We can now create a Session, register the
dpa_lsb_engine, and run it:
from lascar import Session

session = Session(container, engine=dpa_engine)
session.run(batch_size=100)  # traces loaded by batches of 100
Note that the Session.add_engine()
method can be used as well to register the engine to the session.
Finally, to get the result, one solution can be to request the
dpa_lsb_engine.finalize()
method. As most of the engines, the
finalize() method returns side-channels
analysis results. For more option about how to manage the results, please follow
the next step of the tutorial.
results = dpa_engine.finalize()
print(results.shape)
print("Best guess is %02X." % results.max(1).argmax())

import matplotlib.pyplot as plt

plt.plot(results.T)
plt.show()
This will print the best guess and plot the measurements:
Session |100%|####|500 trc/500 | (3 engines, batch_size=100, leakage_shape=(26,)) |Time:  0:00:01
(256, 26)
Best guess is 03.
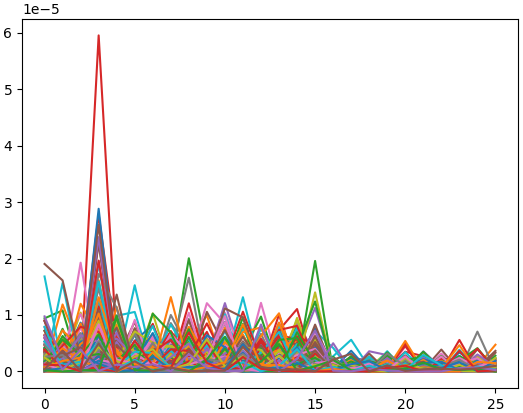
Guesses correlation